Infographics & Datasheets
Expert content for technical professionals and decision makers


Educate
Build Awareness
Create engaging visual graphics for social channels and newsletters to help you stand out to technical professionals.
Connect
Influence Decisions
Create high-quality graphics to influence decision making within organisations, making complex information more accessible.
Engage
Increase Trust
Access a design team who understand and think like TechPros providing accurate code formatting, and world class graphics.
Our Work
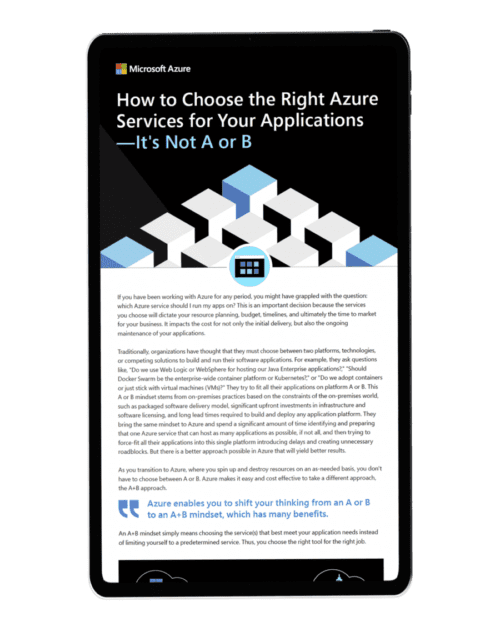
How to Choose the Right Azure Services for Your Applications - It's Not A or B

Infographic commissioned by Microsoft designed to help guide the decision making process for IT professionals choosing which service they should run their apps on. The infographic visually demonstrates the fallacy of a A or B approach to decision making.
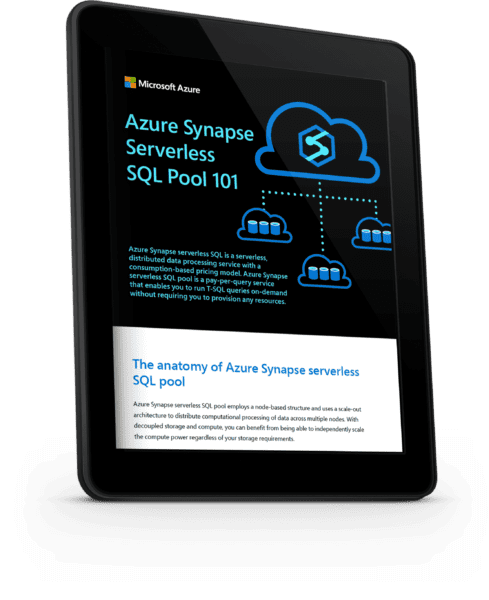
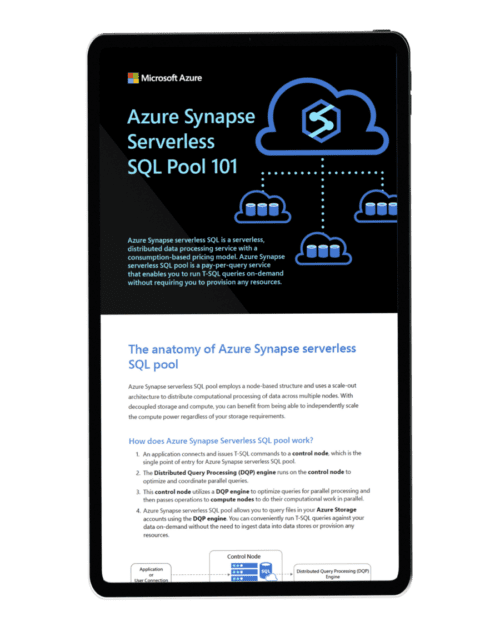
Azure Synapse Serverless SQL Pool 101

This infographic demonstrates the capabilities and advantages of the Azure Synapse Serverless SQL Service. The infographic contains a number of workflows and diagrams to show how the tool works and how a data engineer can leverage its capabilities.
Pricing
Please get in touch to find out more about pricing.
Start generating leads quickly by sponsoring a Packt Book and gating the content. Packt has an extensive catalog of market-proven, independent content to select from across a range of technologies.
Products
Book a Meeting
If you would like to find out more about our partnership services then get in touch and book a meeting with us.

